System Summary and Performance
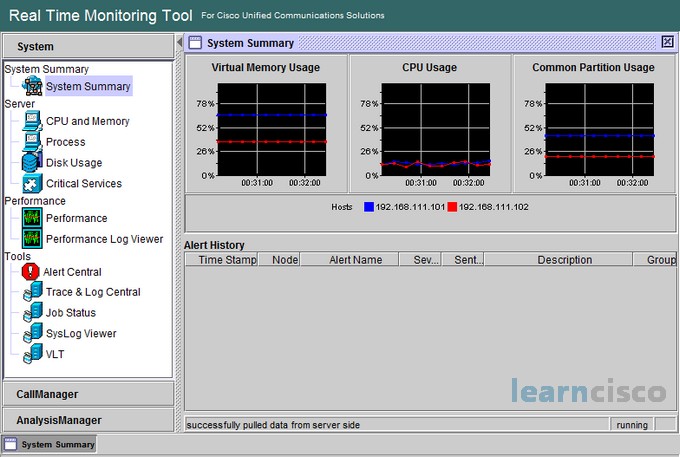
Let’s see how we can get some System Summary information using RTMT. This is one of the most used pages within RTMT. It gives us a great quick overview of the underlying health of the system. We can go under System > System Summary and select System Summary, and we can get a dynamic updating graphical view of our Virtual Memory Usage, the CPU Usage and Common Partition Usage. And we can also see a history of alerts that have been generated along with the severity level of those alerts.

Another one good place in RTMT is the performance area. We go under System > Performance, and select Performance. And we have just a ton of values that we can monitor. Honestly when Cisco went from the Microsoft Windows-based platform and went to the Linux-based platform, I was bit concerned about this. Because back in the old days when we had Call Manager Version 4.X, this performance information came from the Microsoft performance monitor and since we no longer had that to pull data from I was a bit concerned that we were going to be lacking in some of those performance-monitoring statistics. However, Cisco has done an excellent job of making just a wealth of counters available to us. You might want to go in and explore on your gear and just see some of different counters that are available. And if we want to see updating real-time graphs, we can have as many as six graphs on the right-hand side of RTMT. We can drag and drop the counters from the pane on the left over to one of those six blank areas on the right.
Alert Notification Configuration
RTMT is capable of sending us e-mail alerts when maybe a certain threshold has been exceeded, but in order to do that we have to first configure an e-mail server to which it’s going to send those alerts. To do that we can go under System > Tools > Alert > Config Email Server. From here we could type in the e-mail server’s DNS name or IP address, the port, typically port 25 for an SMTP server and the user ID of the sender. Then as part of a specific alert, as part of the action we’re going to take in response to an alert, we can go under System > Tools > Alert > Config Alert Action, and if we edit a specific Alert Action, we’re able to add an e-mail recipient.
Alert Central
RTMT can display for us both pre-configured alerts, and there are several of them, and custom alerts that we create. These alerts are going to show up in Alert Central and they are going to be organized under the appropriate tabs, such as System, Call Manager, Unity Connection, CUP for Unified Presence, and Custom.
We can sort the information in the alert status pane by clicking the up or down arrow that’s shown in the column heading. We can enable or disable or remove an alert from the Alert Status window. What we do is we right-click the alert and choose Disable, Enable Alert, or we select Remove Alert, depending on what we want to do. If we want to customize the alert settings we can right-click a specific alert and choose Set Alert Properties.
Using Remote Browser
There’s an area in that left-hand pane of RTMT called Trace and Log Central, that’s going to allow an administrator to for example view trace log information.
What you can do is go under that Trace & Log Central area, select Remote Browse, select that you want to view Trace Files and click on Next and it will open a screen of the wizard.
Now we’re prompted to select a Communications Manager service or an application from the listing from a specific server or all of the servers, and then we click on Next, then we can select a specific service or services on that selected server or servers. And when we’re done, we click on Finish.
After RTMT sends the request to the Communications Manager to collect the data that we have just requested, and the data has been prepared for us, we’re going to get a message saying that the remote browse is ready. We can click on Close and we can open the file and by clicking on the folder hierarchy we can drill down to the file that we requested, select that file and we could click on Download the file. We could click on Delete the file if we want to get rid of it, but typically we want to download the file so that we can view it.
SysLog Viewer
In addition to storing data in Trace Logs, Cisco Communications Manager can also log alerts out to a syslog server. It could log alerts to an external syslog server or it has its own internal syslog server that it could log alerts to. And if we want to retrieve information from that internal syslog server we can go under the Tools area and select SysLog Viewer, we select the type of log that we want to view such as the system log, an application log, a security log and we’re going to be able to get a view of the syslog file contents. Much like we see on screen where we can see a Date timestamp, we can see the Machine Name, we can see the Severity level, we can see what Process caused the alert and we can see information about the process that caused the alert.
CallManager Summary
Recall that we mentioned earlier the CallManager Summary view, this is going to give us a nice concise view in one window. Much like we could have a nice concise view of System Summary information, we can also have a concise view of CallManager Summary information. To get to this screen that’s going to consolidate information about Registered Phones, Calls InProgress and Active MGCP ports and Channels we can go under CallManager > CallManager Summary, and select CallManager Summary. And this is going to give us a three-paned view into the performance of our Communications Manager cluster.
Using Profiles
As you can tell by this point, RTMT has a lot of different features and we might want to arrange our views and arrange our windows in a certain structure to get good access to the information that we’re interested in. And if we want to save those views that we’ve created we can save those as profiles. If we create a view that we want and we want to save it, we could go under the File menu, select Profile and say Save and give information about the profile that we’re saving. We give it a name and we could give it a description.
Database Summary
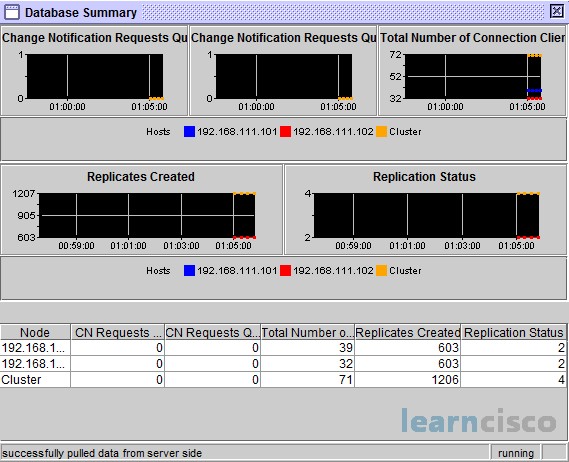
A fairly common troubleshooting issue that you might run into with Communications Manager servers revolves around database synchronization. If we want to check on the database synchronization status we can use RTMT to do that.

Notice we’re going into the Database Summary window and we can check the Replication Status for specific servers in the cluster. If that status reports zero that means that no subscribers exist, in other words replication is not started. One indicates that replication has started it’s currently being set up, two’s what we want. Two means that replication has finished, it’s complete, it’s working. Three indicates a broken replication and four indicates that replication is not set up correctly.
Our Recommended Premium CCNA Training Resources
These are the best CCNA training resources online:
Click Here to get the Cisco CCNA Gold Bootcamp, the most comprehensive and highest rated CCNA course online with a 4.8 star rating from over 30,000 public reviews. I recommend this as your primary study source to learn all the topics on the exam.

Want to take your practice tests to the next level? AlphaPreps purpose-built Cisco test engine has the largest question bank, adaptive questions, and advanced reporting which tells you exactly when you are ready to pass the real exam. Click here for your free trial.
